Debugging Proxy Sessions
Sometimes is might be helpful to actually look into the bytes that the client sent to the proxy server, for example to debug problems with Kerberos/NTLM authentication. To do that, follow these steps.
First, make sure no other user is accessing the proxy at this time. This will prevent the flood of debugging information that can make understanding the problem much easier.
Next, enable debug dump of proxy sessions in Proxy Settings / General / Debugging as shown on the following screenshot.
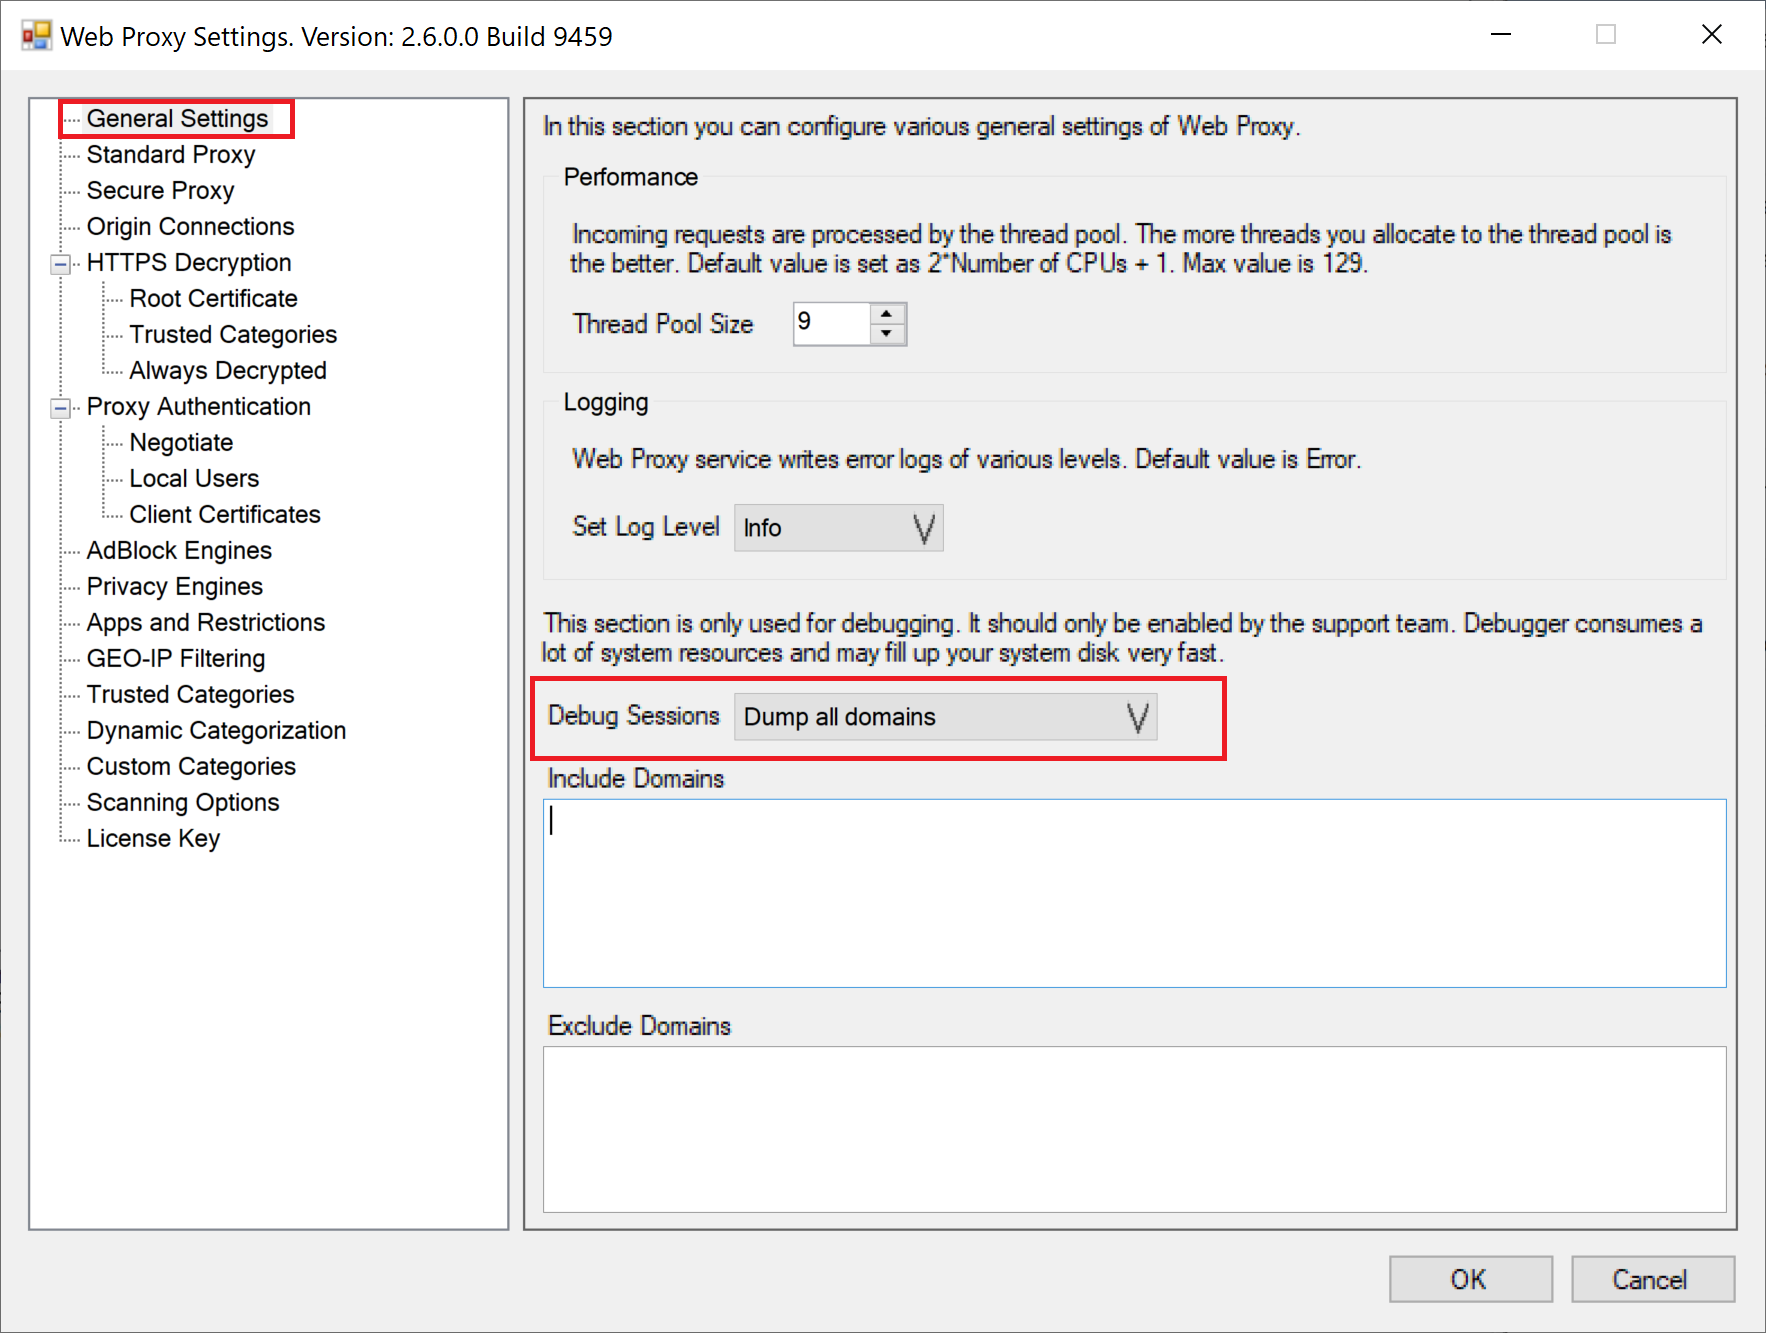
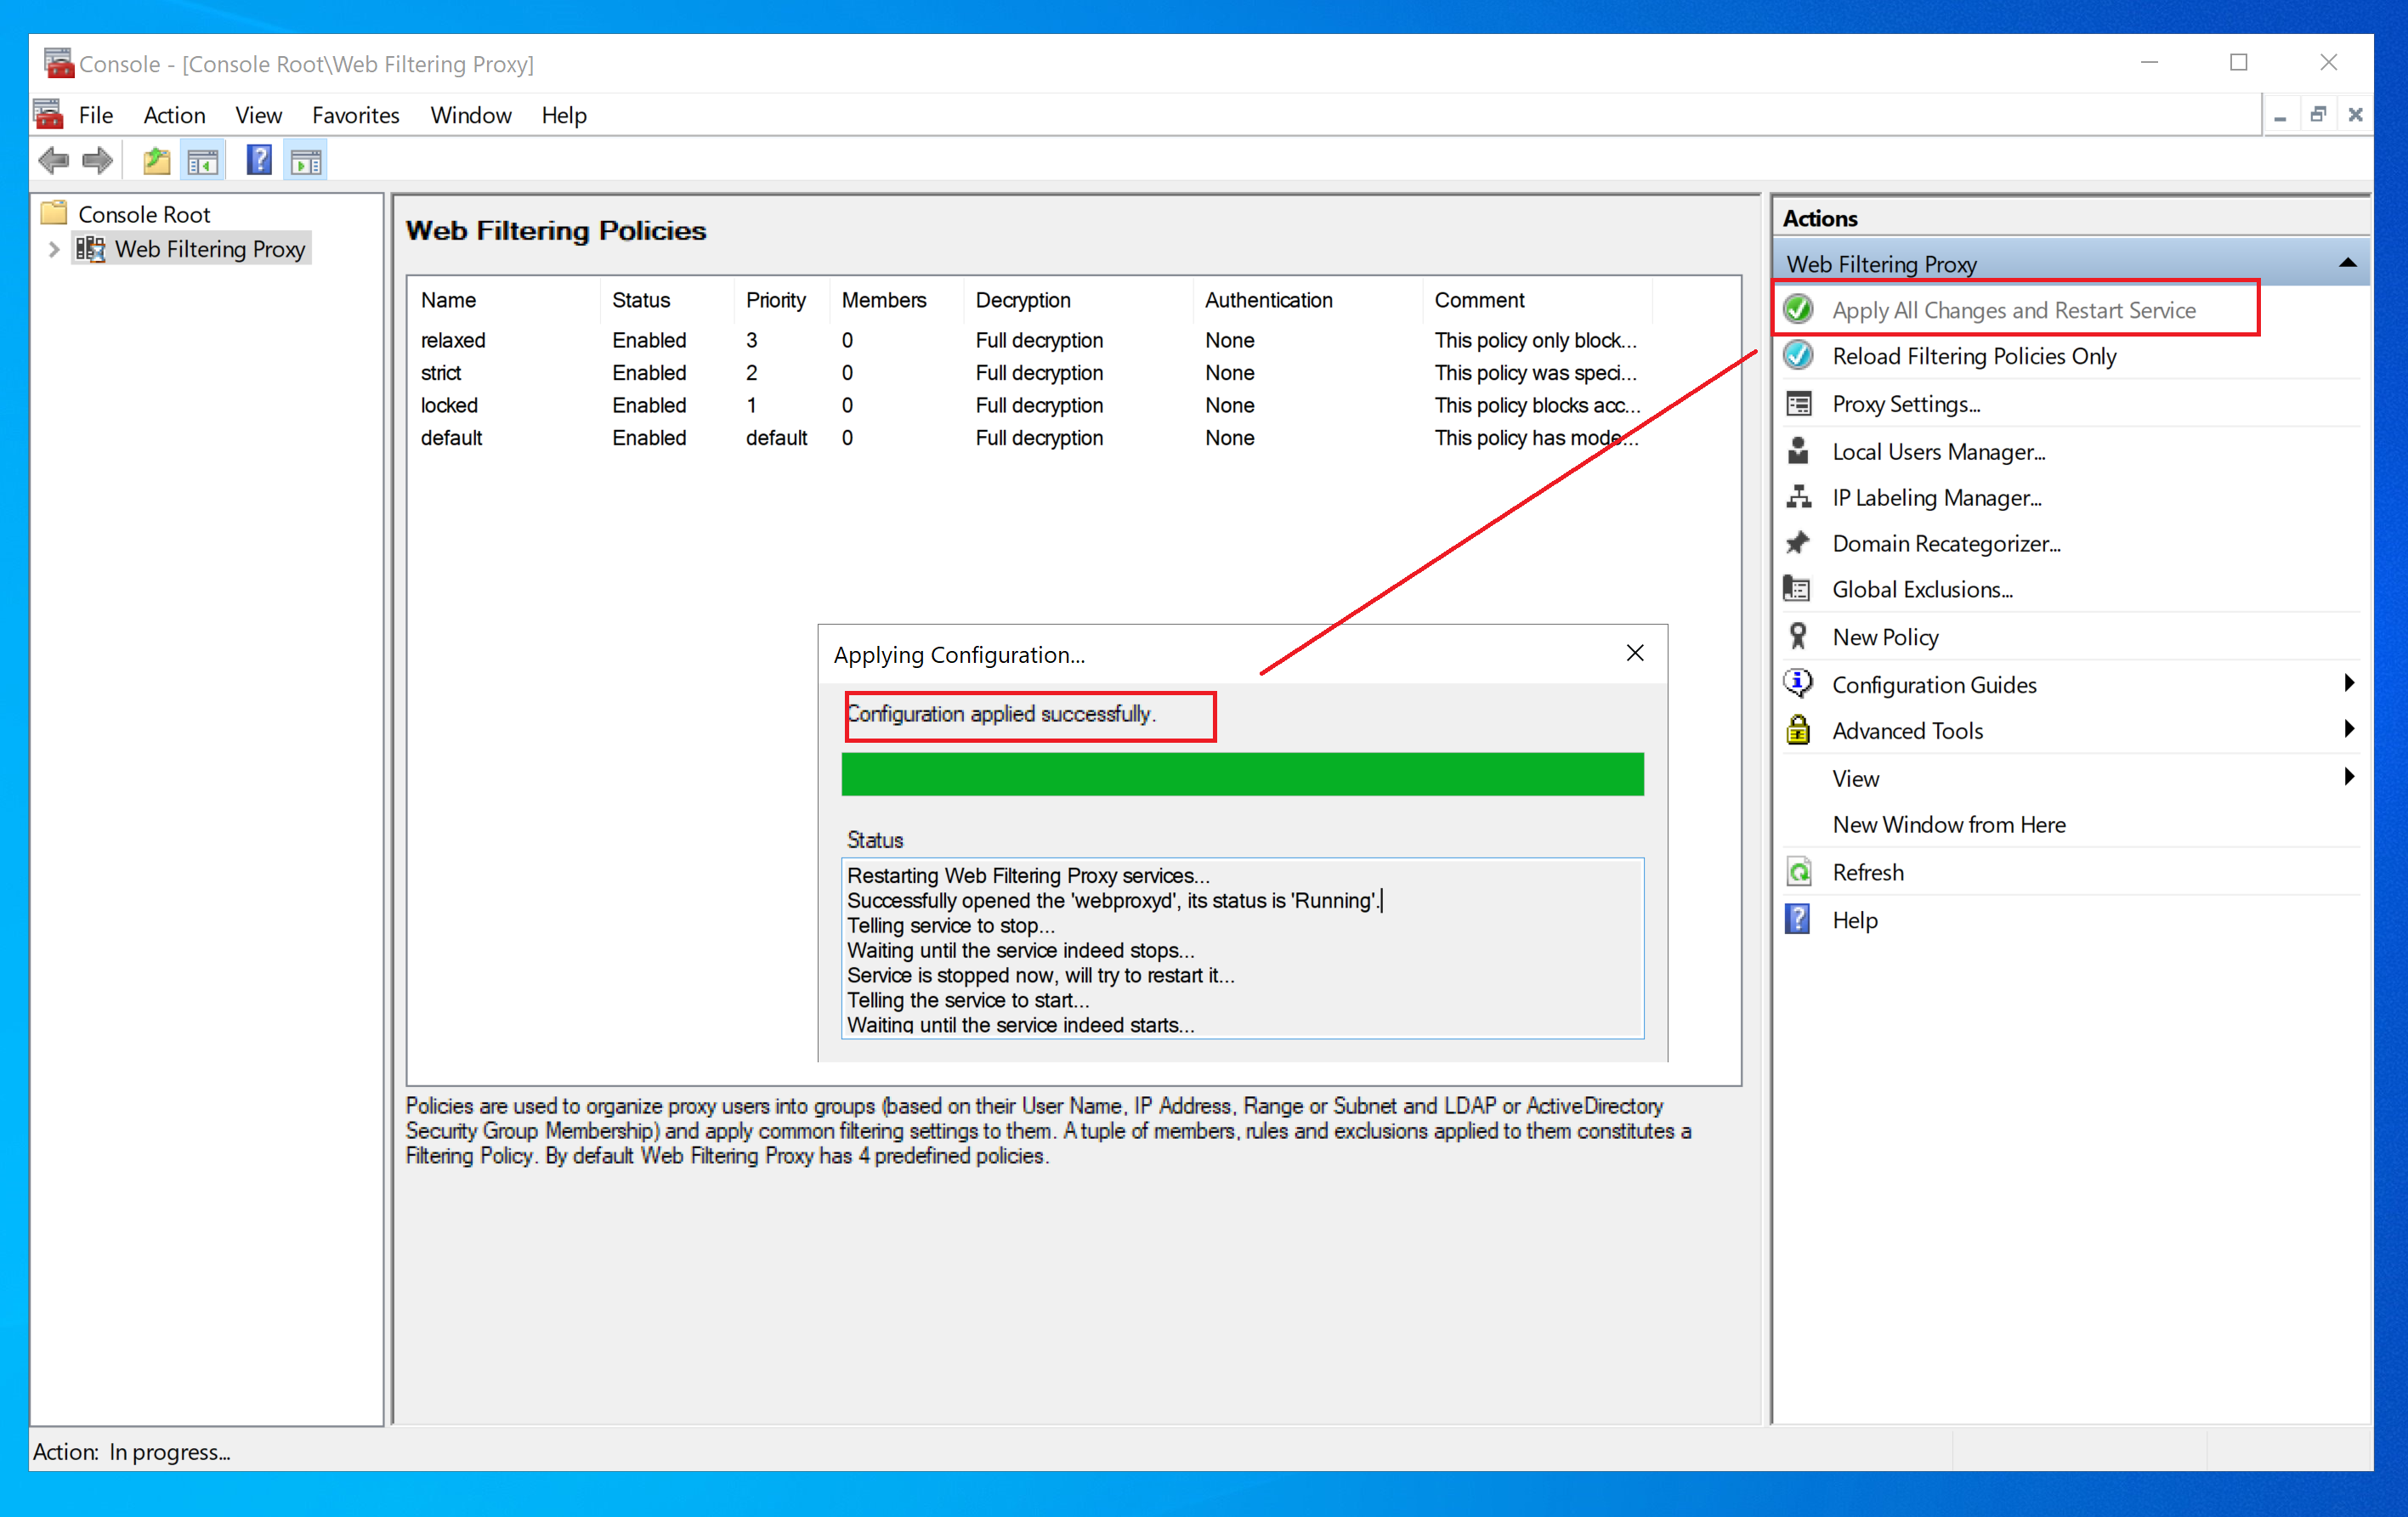
Click Save and Restart and wait a couple of minutes to let the proxy server fully initialize all its internal resources.
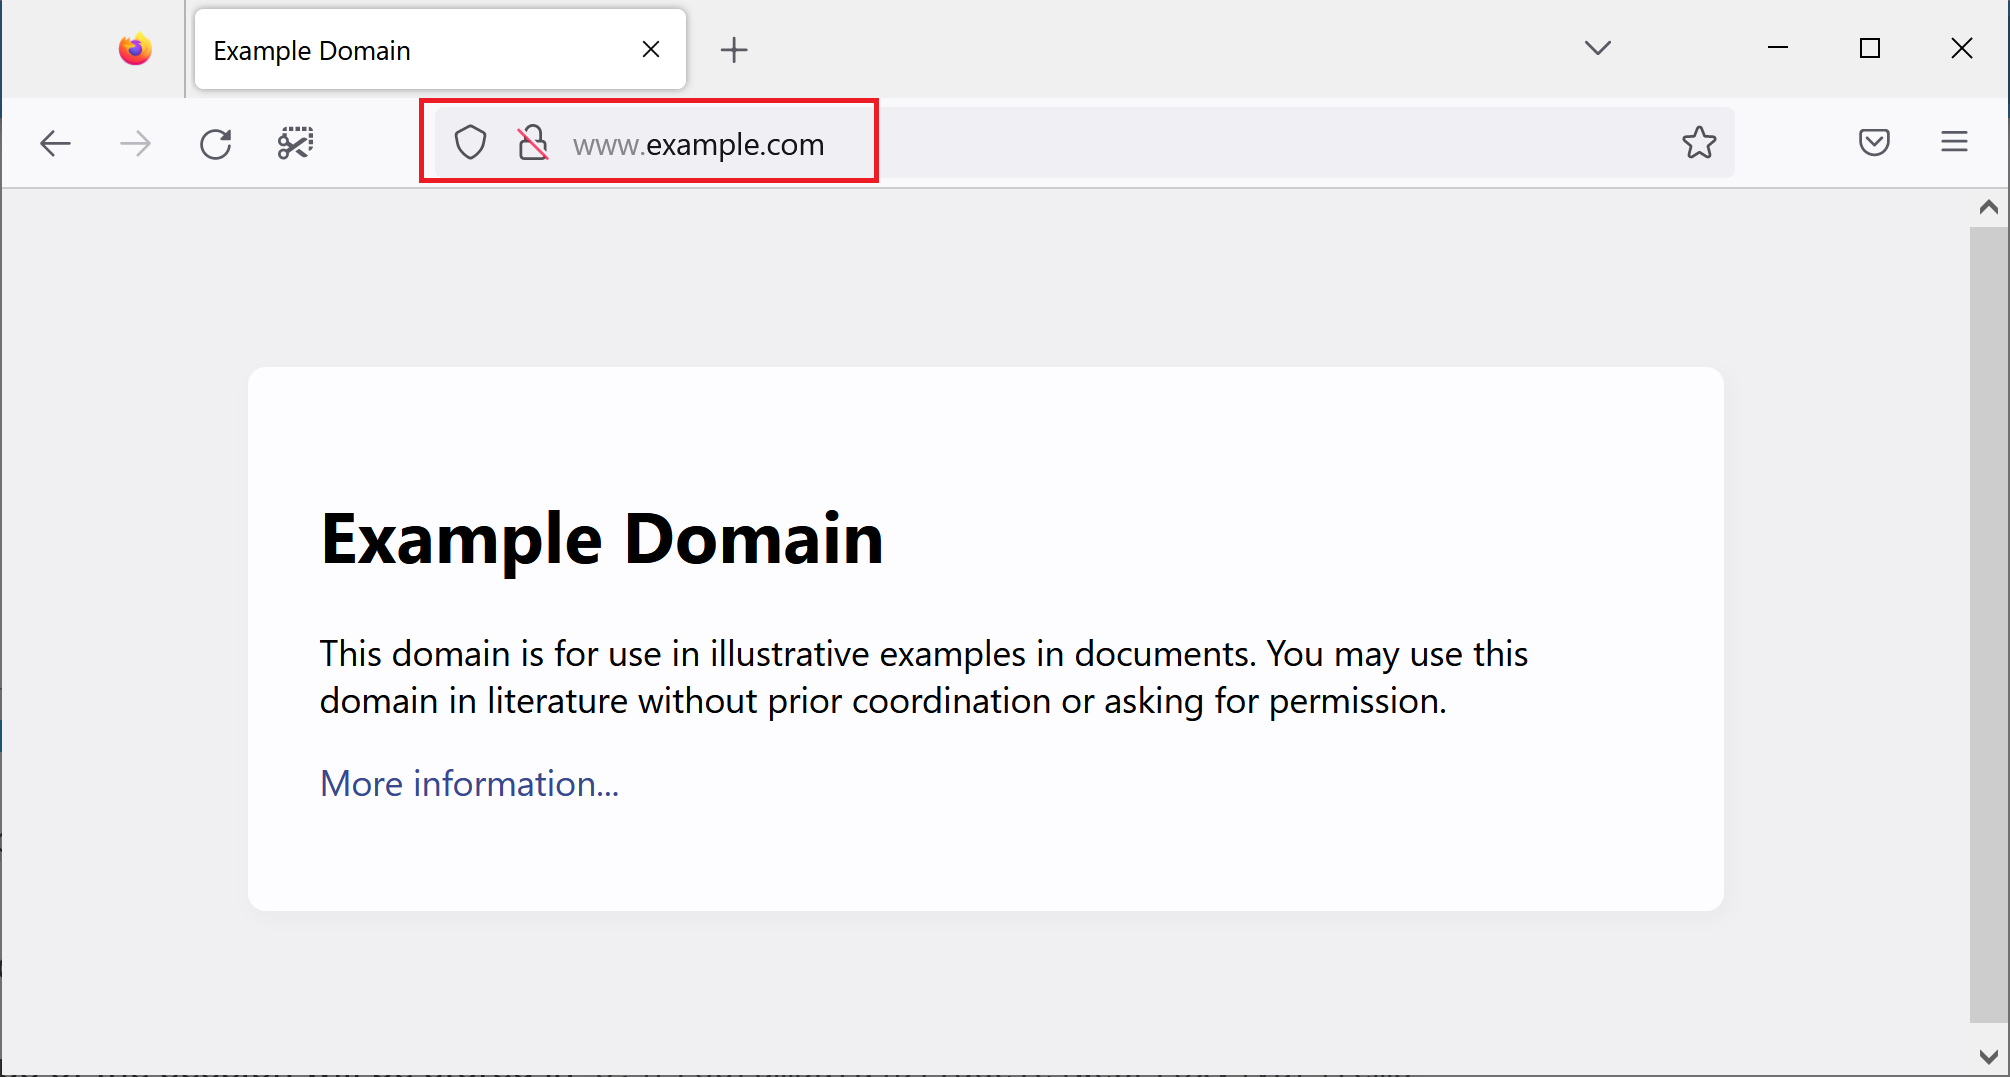
After that open your browser and try accessing a simple site, for example, http://www.example.com - use HTTP or HTTPS prefix as required. When the browser rendered the page, close it as it is not needed any more. Note, when browser is closed all sessions are completed and written to disk.
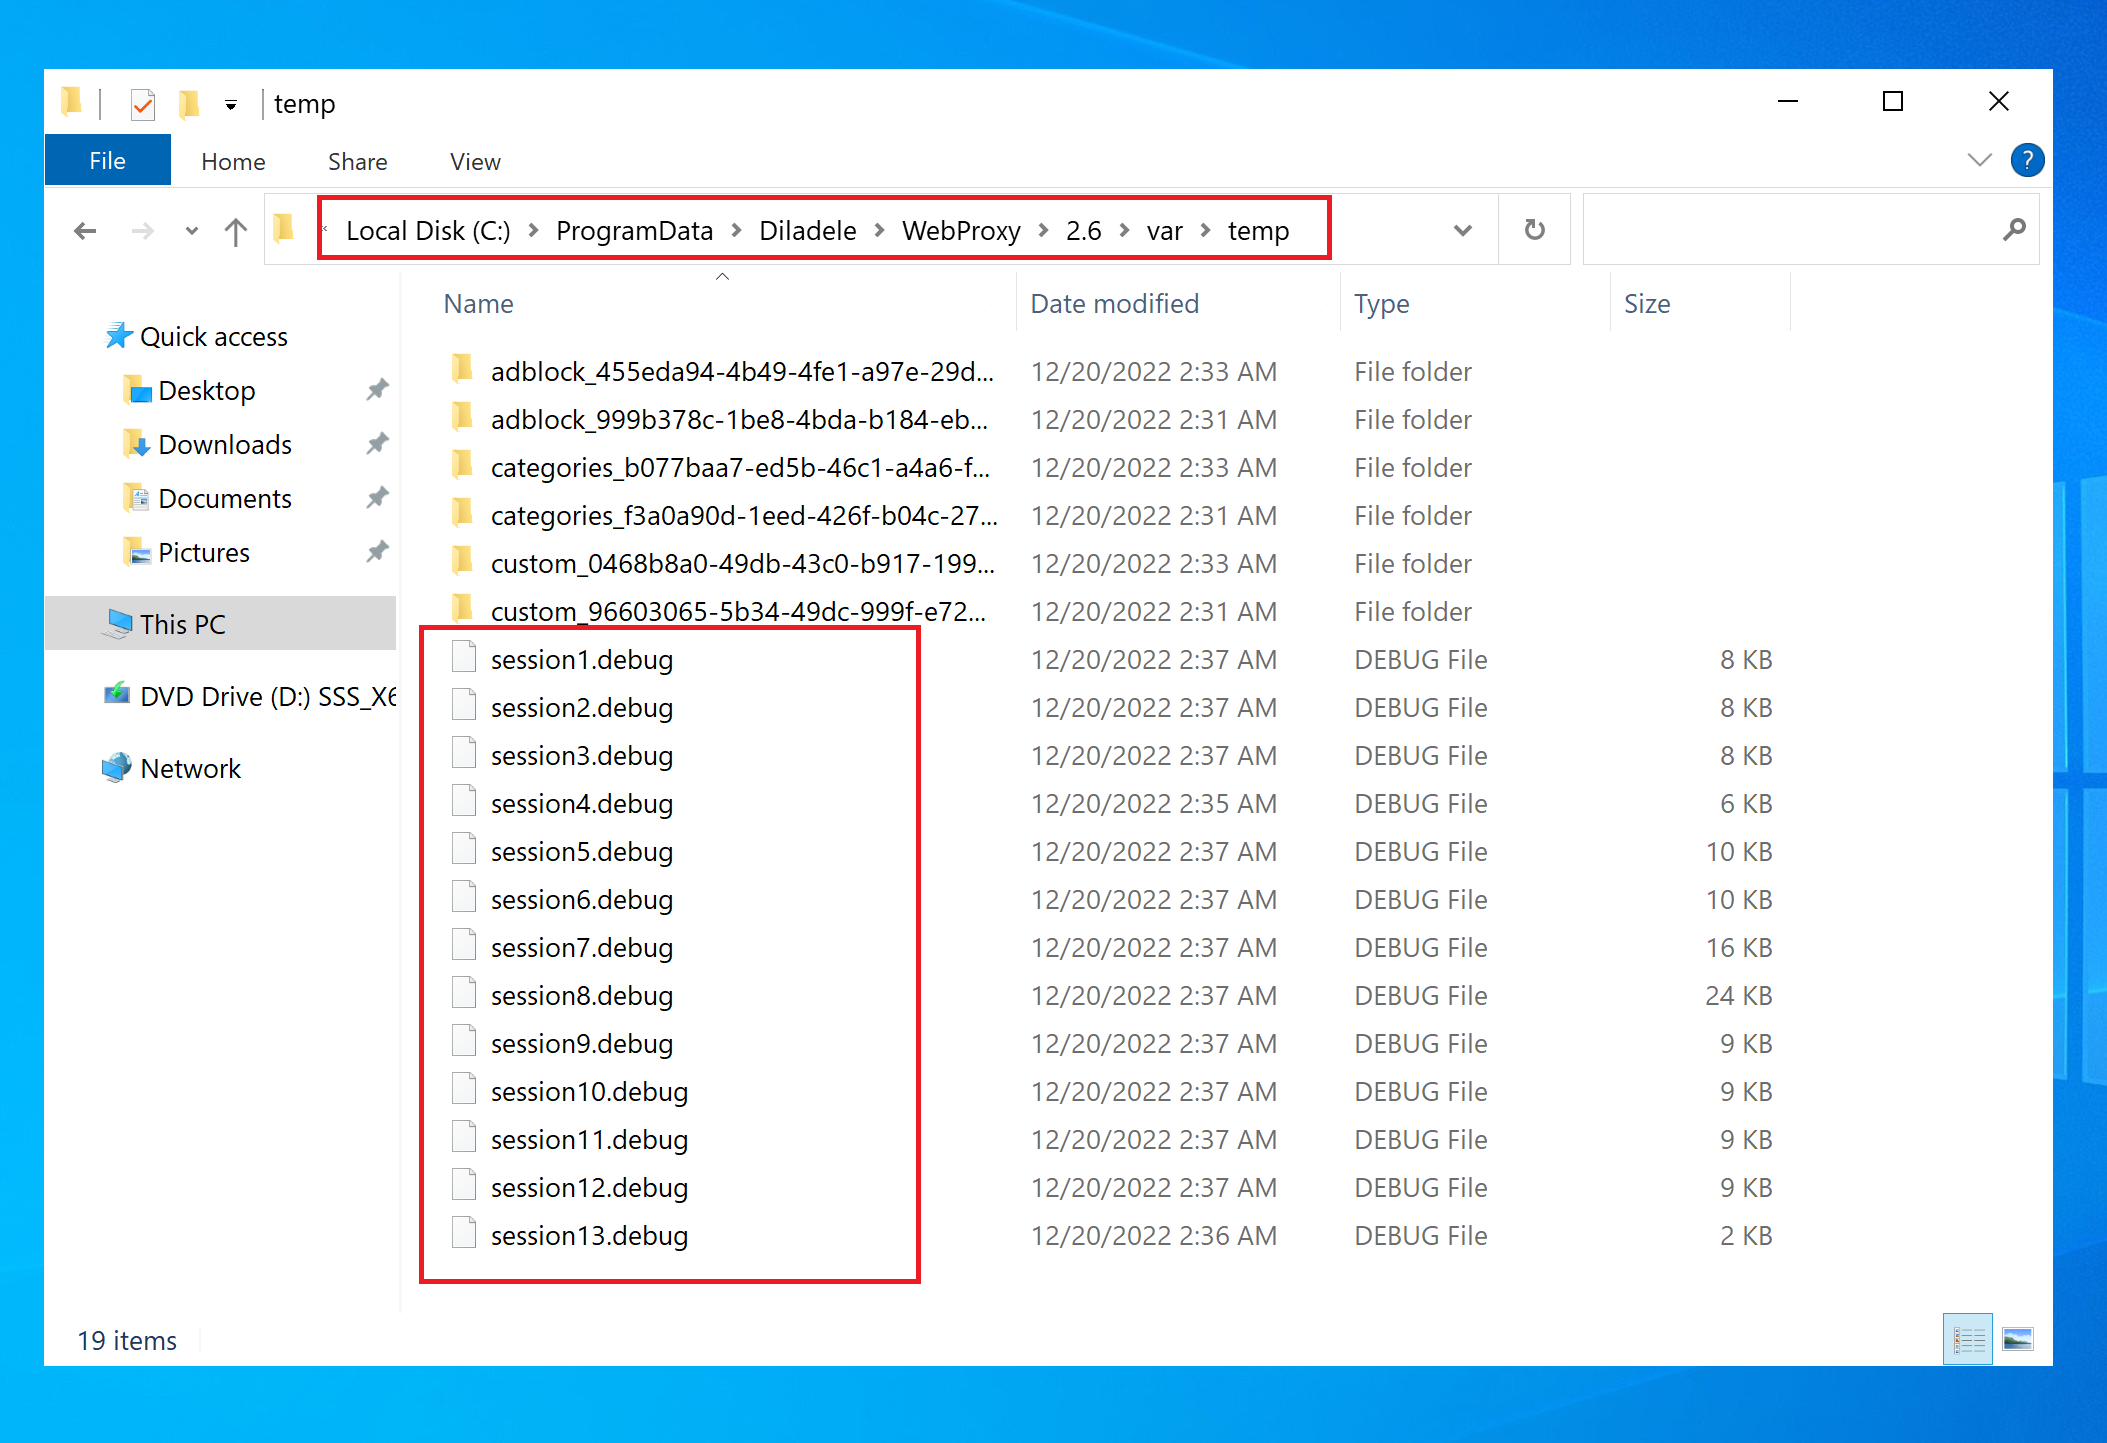
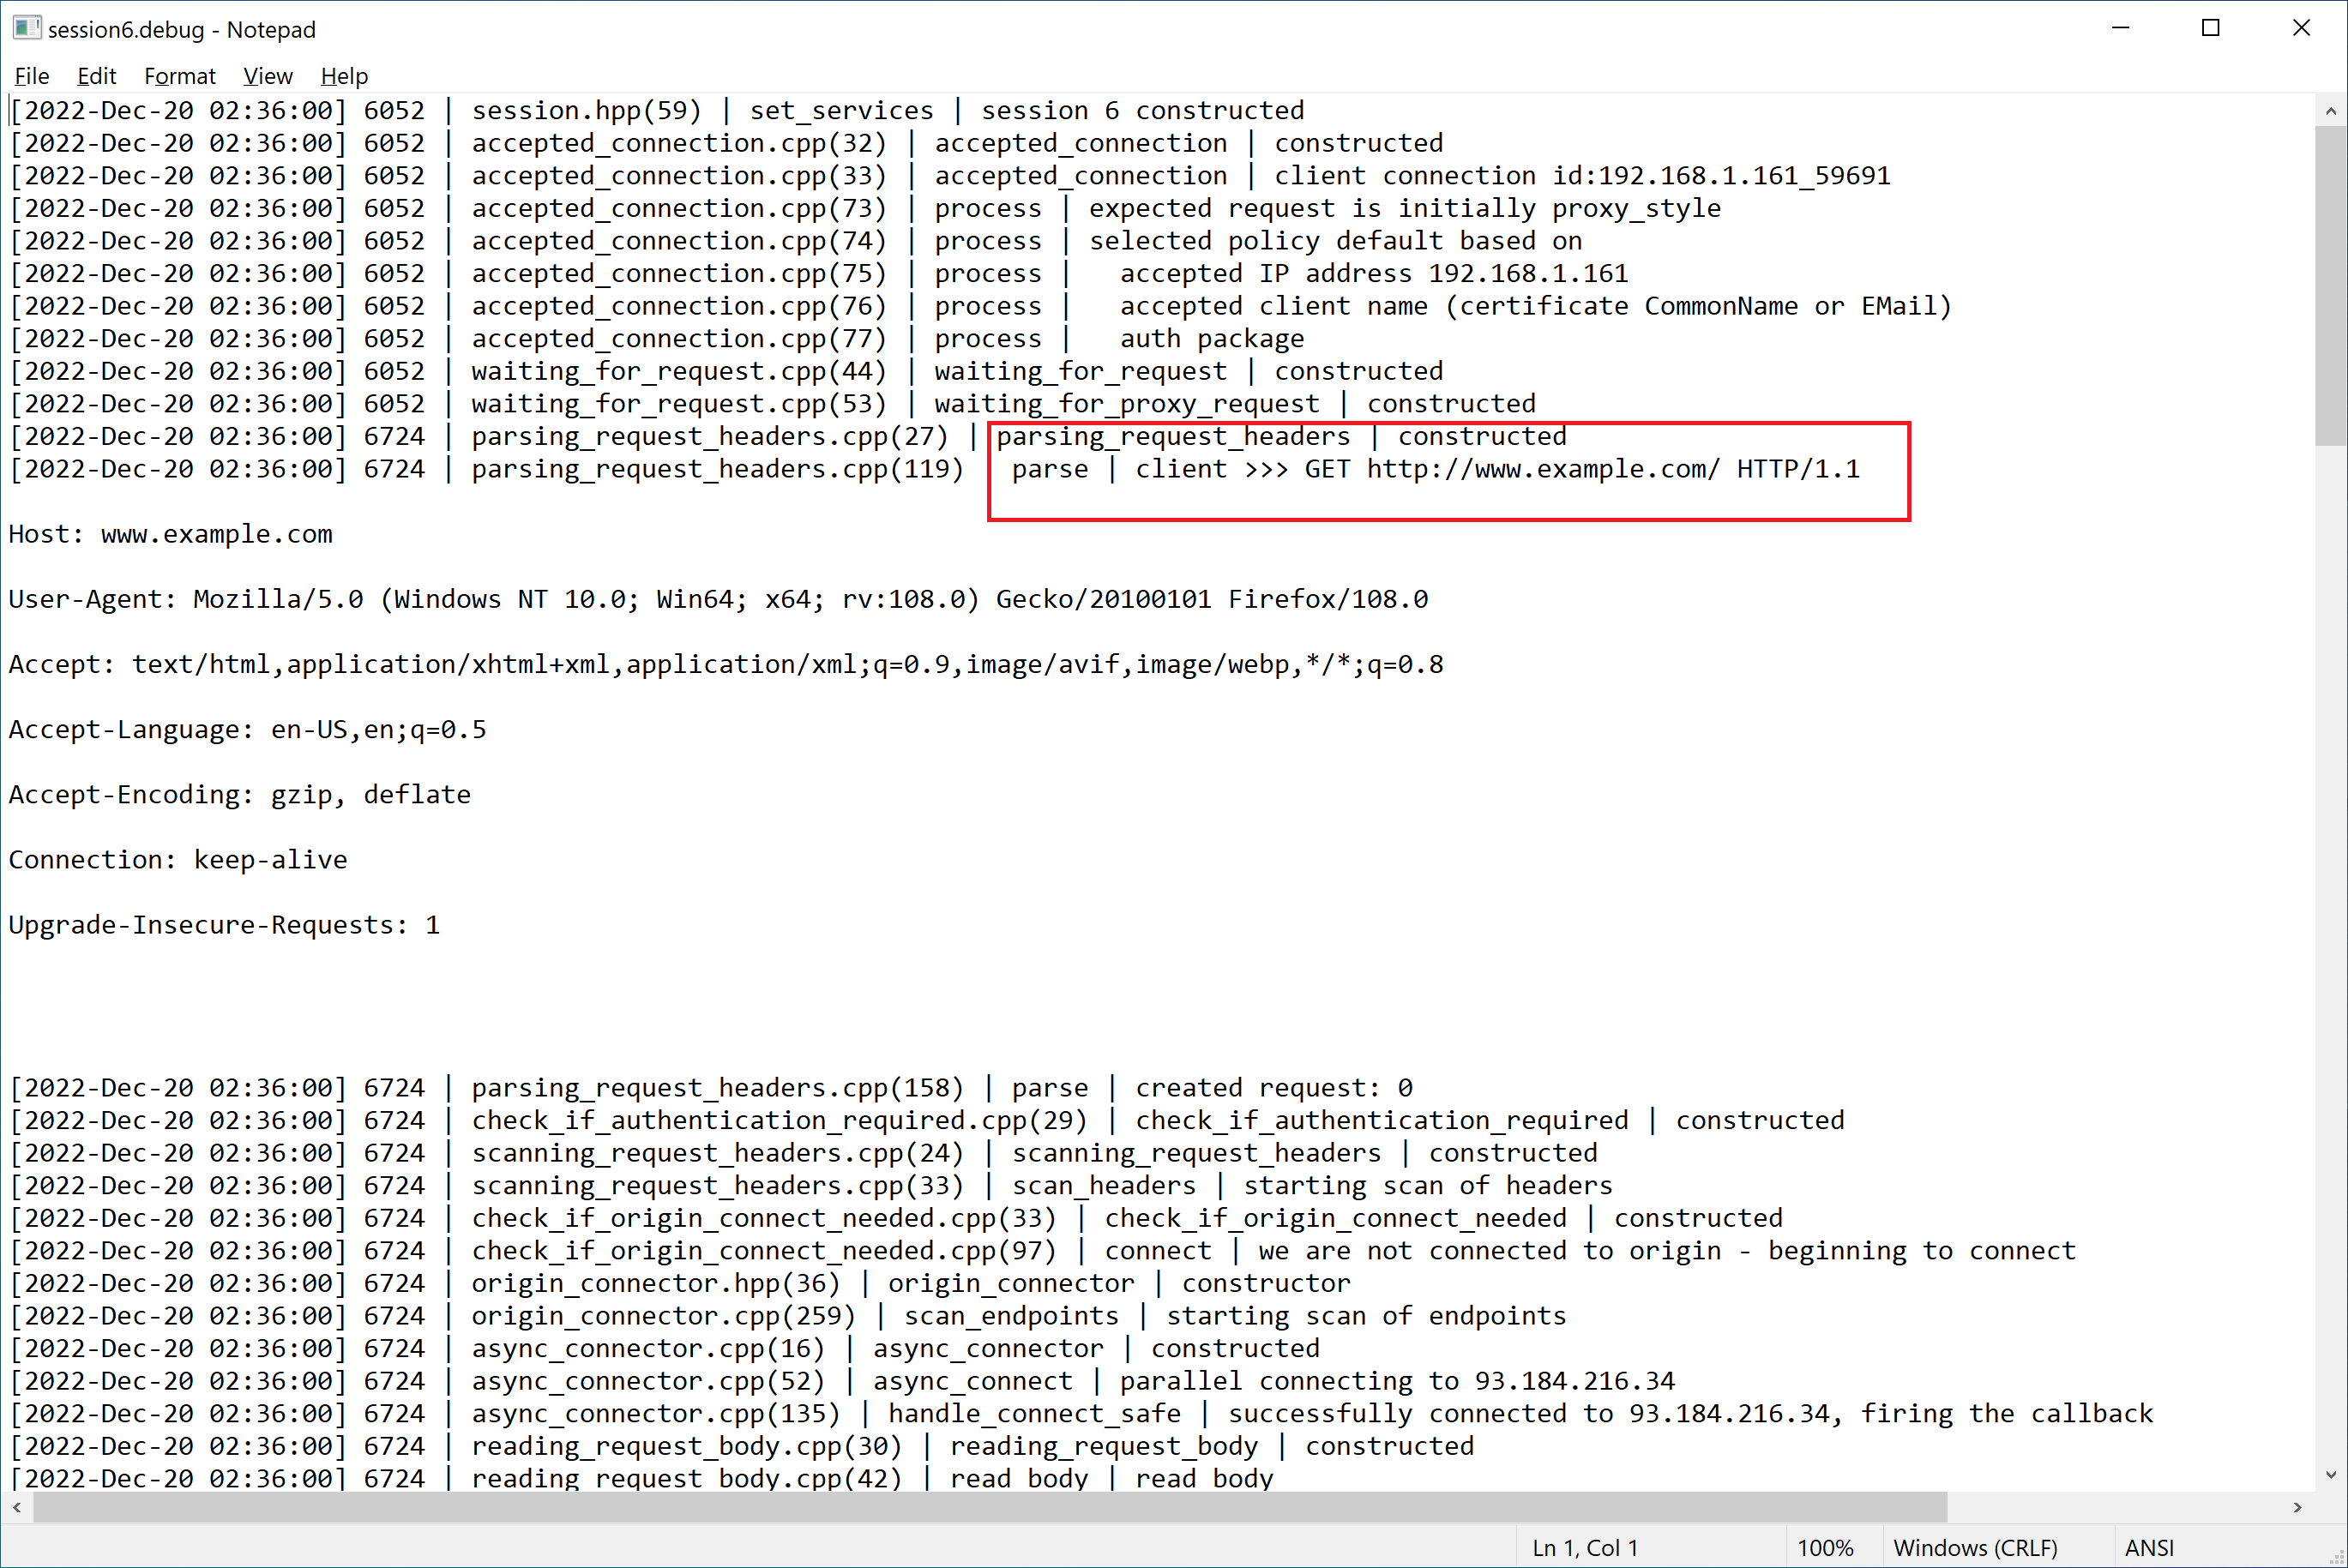
Debug dumps of the session will be stored in C:\ProgramData\Diladele\WebProxy\var\temp folder as session*.debug files - each file corresponds to one connection created by the browser. Files are named as session1.debug, session2.debug and so on in ascending order.
Each file is a text file that you can read yourself or send to support@diladele.com for analysis. Example content is shown below.
Finally, do not forget to disable debug after you have completed investigation.